

Which Communities Go Dark in a Storm?

Tuesday, July 7, 2026
Digital Beat
Which Communities Go Dark in a Storm?

In late September 2024, Hurricane Helene made landfall on Florida’s Gulf Coast and drove more than 400 miles inland, into the southern Appalachians, mountain country that does not expect hurricanes. The storm devastated valleys and hollows. Roads were washed out, and in many places the power stayed off for weeks. In Henderson County, North Carolina, local internet provider Morris Broadband went dark. For 80 hours, or more than three days, its network was down. The households and businesses that depended on the network spent those days cut off, just when they needed to reach family members or file insurance claims.
On broadband coverage maps, Henderson County is counted as “served.” On the other hand, broadband infrastructure in the county had not been built to survive a storm like Helene, and nothing in the way we ordinarily measure broadband would have informed local stakeholders of these vulnerabilities.
Closing that gap is what my colleagues and I set out to do. In earlier work in rural Nebraska, we found that an internet service provider’s advertised speed and a household’s actual experience of using the internet can be worlds apart. Disasters expose a second, harsher version of the same problem. Broadband can show up on every coverage map and still go down the week people need it most. So, we built a tool to measure each community’s risk of losing broadband. When a storm keeps people indoors, the home connection is what carries telehealth visits and kids’ schoolwork, and a coverage map says nothing about whether that connection will hold up. The tool flags the places most likely to go dark in a natural disaster, so broadband offices and emergency managers can harden networks and stage backup equipment before the next storm hits.
Introducing the Hazard-Adjusted Broadband Reliability Index (HABRI)
We call this tool the Hazard-Adjusted Broadband Reliability Index (HABRI). The project is a collaboration with Angela K. Hollman of the University of Nebraska at Kearney.
HABRI weighs three components. The first, hazard exposure, comes directly from the Federal Emergency Management Agency (FEMA) and its National Risk Index. This component measures how much potential danger a census tract faces from the natural hazards that threaten networks most in the Southeast, weighting flooding most heavily, then hurricanes, then landslides.
The second component, infrastructure fragility, captures something most measurements of broadband coverage leave out. Some of the factors that comprise infrastructure fragility are obvious, like how many cell towers are within reach, how slowly the connection already runs on a clear day, and the condition of the electric grid the network depends on. However, one is less obvious. Is the community reliant on a single road? We measure that reliance from the road network itself. Starting from a map of every road segment in the state, we calculate how much of the travel between places must funnel through a few stretches of pavement. Where one or two routes carry nearly every path in and out, that is a single road community. In the mountains, a narrow valley routinely carries the road and the fiber along the same few miles, so when the road washes out, the lines beside it are often left inoperable as well.
The third component, coping capacity, represents how well a community can absorb the hit of a natural hazard. For example, a household with no car and no backup way to get online rides out a week offline far worse than one that has both, and a tight budget makes everything more difficult. We draw these measures—including vehicle access, reliance on a phone alone for internet, disability rates, income, and poverty—from the Census Bureau’s American Community Survey.
In the composite score, hazard exposure counts for 40 percent, infrastructure fragility for 35 percent, and coping capacity for 25 percent. The rankings hold up. We re-ran the index under five alternative weighting schemes, and the same places kept rising to the top. What HABRI leaves out matters as much as what goes in. The index does not use providers’ own coverage claims (i.e., the data behind the maps that counted Henderson County as served) and does not depend on any proprietary network information. Every input is public, so any state agency can reproduce the score, update it, or argue with it. For example, broadband speed data comes from tests that users run on their own connections rather than from provider filings.
Every census tract receives a HABRI score between zero and one. The higher the score, the more likely that community is to lose broadband service in a disaster, and the longer it is likely to stay dark. So far, we have computed a HABRI score for every census tract in North Carolina and Tennessee, and an interactive map of both states is available online.
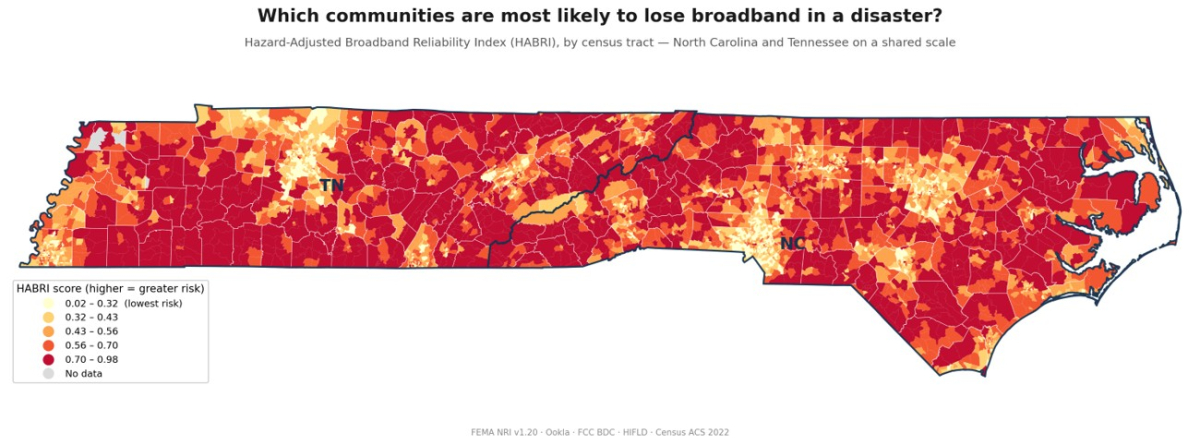
HABRI scores for every census tract in North Carolina and Tennessee, shown on one shared scale. The reddest tracts face the highest risk of losing broadband in a disaster, and most of them are rural. An interactive version lets you hover over any tract to see its score and risk profile.
Because there are different types of vulnerability, we also use HABRI to sort tracts into three types, each pointing toward a different fix. Transport-Fragile places are the most acutely vulnerable to long outages, because the same washed-out road that severs the fiber also keeps the repair crews out. In North Carolina, 226 of the state’s 2,660 tracts fall into this group, many of them the same mountain valleys and hollows cut off by Helene. Transport-Fragile communities need route redundancy and a satellite fallback to stay online. Power-Dependent places, the second type, fail another way, with the electric grid as the weak link, so backup power and tower batteries matter most. These are the largest group, just over half of North Carolina’s tracts. The third type is Dual-Risk, those places where the index runs high on every front at once, combining hazardous terrain, fragile infrastructure, and households with fewer resources to cope. There, the hardening has to be layered. A generator at the cell tower does little good if the only fiber route into the valley runs beside a road in the floodplain. These communities need backup power and a second route together, ideally with a public anchor, a library or school, that keeps a connection the whole community can reach when home service fails.
Did HABRI Predict Broadband Failures?
The HABRI model and its computed risk scores are only valuable if they accurately predict damage before a disaster. So, we built HABRI entirely from data that predated the storm, then checked it against Helene’s impacts. Three independent records of the damage all pointed in the same direction: millions of consumer speed tests collected by Ookla, the county outage reports that providers filed with the Federal Communications Commission (FCC) during the disaster, and global internet routing data from the Internet Outage Detection and Analysis (IODA) project, which shows when a network disappears from the internet entirely. Across North Carolina’s 100 counties, the places HABRI rated as most at risk were also, by a statistically significant margin, the ones that later reported the most outages to the FCC. And the tract served by Morris Broadband, the provider whose network had vanished for 80 hours? It sat in the 93rd percentile of risk statewide.
The most informative test of the HABRI model involved the roads themselves. If a ruined road takes fiber and cable lines down with it, then road fragility should predict damage to wired broadband while having less effect on cellular service. Cellular networks ride on fiber too, but the last link to the phone travels over the air, and a wired connection follows the pavement all the way to the house. That is what we found. Where the roads were most fragile before the storm, fixed broadband degraded the most afterward, while cellular performance barely changed.
That split is the reason broadband needs its own measure. A cellular network usually fails when the power quits and the batteries at the tower run down. Broadband goes down for a different reason. A road gives out and takes the fiber beside it. Fold the two into one communications risk score and the average buries what a planner has to act on, because keeping a cell site alive in a storm and keeping the fiber lit call for different work. A score built on how broadband breaks points to the right repair.
After the Storm
HABRI is designed to refresh risk scores every quarter from publicly available speed test data, which means it can also track recovery after the storm has passed. When a community’s measured performance stays below its own pre-storm baseline quarter after quarter, the network has not really come back, whatever the coverage map says.
Henderson County shows how long that can take. Latency, the round-trip signal delay that governs how responsive a connection feels, ran high there even before Helene. A typical speed test showed about 28 milliseconds, a third slower than the statewide figure of about 21. The quarter after the storm, Henderson’s number jumped to 37 milliseconds even as the statewide figure improved slightly. By the end of 2025, the county had worked its way back to 28 milliseconds, its old level. But the rest of North Carolina had improved to 15 in the meantime. A county’s networks can claw their way back to baseline speeds and still sit further behind their neighbors than they did before the storm.
That pattern points to a concrete use for the quarterly readings. Disaster dollars arrive in waves, and the later waves, such as the Department of Housing and Urban Development’s Community Development Block Grant disaster recovery funds, are often allocated a year or more after the event, when national attention has moved on. Quarterly HABRI readings give those later allocations an evidence base. A county still performing below its pre-storm baseline four quarters out is a strong candidate for supplemental help, whether from state recovery funds or from that later federal wave.
A Path Forward
The country is in the midst of the largest broadband infrastructure expansion in its history, and the $42.5 billion Broadband Equity, Access, and Deployment (BEAD) Program is funding new networks across the rural places HABRI was built to assess—remote, isolated, or sparsely populated areas often exposed to hazards. After multiple changes to the BEAD Program, the funding awards have increasingly gone to whichever internet service provider bids lowest to serve an area. However, the cheapest network to build is not always the one left standing after a flood. A few guardrails, grounded in the data, could help.
First, state emergency managers can stage backup connectivity, like portable cell sites and satellite units, in the tracts at highest risk before a storm makes landfall. HABRI generates a ranked list to work from, tract by tract. Second, state broadband offices can act earlier to ensure infrastructure is resilient. In the areas showing greatest risk to broadband infrastructure, officials can score funding applications on how well a network will hold up in a natural disaster, with hardening measures like buried conduit and redundant fiber routes, rather than on upfront cost alone. After all, paying more for network infrastructure that survives a storm is cheaper than rebuilding infrastructure that doesn’t. Third, recovery programs have the clearest choice of all. They can fund a second, independent fiber route into Transport-Fragile communities. That route is the single change most likely to keep a mountain town online through a flood, and it already qualifies for funding under FEMA’s existing Hazard Mitigation Grant Program and disaster recovery grants.
The Stakes
The U.S. spends billions of dollars building broadband networks, then billions more rebuilding them after a natural disaster. Knowing in advance which networks will fail, and hardening those first, would spare a good share of the second bill. Helene made that case at a brutal cost. We shouldn’t need it made again.
Jesse R. Andrews is a postdoctoral research associate at Texas Tech University’s Center of Excellence in Capacity-building for Resilient Housing (CECREH), where he studies flood risk, housing resilience, and the rural digital divide. His research on flood exposure, rural mitigation planning, and broadband quality and adoption has appeared in the International Journal of Disaster Risk Reduction, Natural Hazards, Environment and Planning B: Urban Analytics and City Science, and Telecommunications Policy. He is a 2025 Benton Broadband Opportunity Fund Fellow.
The Benton Institute for Broadband & Society is a non-profit organization dedicated to ensuring that all people in the U.S. have access to competitive, High-Performance Broadband regardless of where they live or who they are. We believe communication policy - rooted in the values of access, equity, and diversity - has the power to deliver new opportunities and strengthen communities.
© Benton Institute for Broadband & Society 2026. Redistribution of this email publication - both internally and externally - is encouraged if it includes this copyright statement.
For subscribe/unsubscribe info, please email headlinesATbentonDOTorg

Kevin Taglang
Executive Editor, Communications-related Headlines
Benton Institute
for Broadband & Society
1041 Ridge Rd, Unit 214
Wilmette, IL 60091
847-220-4531
headlines AT benton DOT org
Share this edition:


Broadband Delivers Opportunities and Strengthens Communities