FCC: Broadband Market is on the Cusp of Generational Change

Friday, January 6, 2023
Weekly Digest
FCC: Broadband Market is on the Cusp of Generational Change
You’re reading the Benton Institute for Broadband & Society’s Weekly Digest, a recap of the biggest (or most overlooked) broadband stories of the week. The digest is delivered via e-mail each Friday.
Round-Up for the Week of January 2-6, 2023

On Friday, December 30, 2022, the Federal Communications Commission released its third Communications Marketplace Report. In the RAY BAUM’S Act of 2018, Congress requires the FCC to assess the state of competition in the communications marketplace. Every two years, the FCC must evaluate competition to deliver voice, video, audio, and data services among providers of telecommunications, providers of commercial mobile service, multichannel video programming distributors, broadcast stations, providers of satellite communications, internet service providers (ISPs), and other providers of communications services. The FCC last completed a marketplace report in 2020 under then-Chairman Ajit Pai. Here we focus on the FCC's findings concerning broadband, a market, the commission notes, that is "on the cusp of generational change" because of the $65 billion that the Infrastructure and Investment and Jobs Act is investing in broadband adoption and deployment throughout the country.
I. Overview of the Broadband Marketplace
1. Broadband Providers
As of December 2021, there were 2,201 entities of varying sizes and deployment footprints that reported providing fixed broadband technology services to residential consumers at speeds exceeding 200 kbps in at least one direction. This is an increase of approximately 10% since December 2018 (the number of providers in urban areas and rural areas increased by approximately 12% and approximately 10%, respectively).
There is considerable variation in broadband provider size and deployment footprint. The overwhelming majority of providers cover less than 1% of the U.S. population and only 11 providers cover at least 5% of the U.S. population: T-Mobile, Verizon, AT&T, Comcast, Charter, Lumen Technologies (CenturyLink), TDS, Frontier, Cox Communications, Altice USA, and Jab Wireless (Rise). T-Mobile has the largest footprint of fixed broadband, covering approximately 60% of the U.S. population through its fixed wireless technology. Both Verizon and AT&T cover approximately 40% of the U.S. population, and Comcast and Charter cover approximately 36% and 33%, respectively. There is a large falling-off in deployment coverage after the top five: Lumen Technologies covered approximately 17% of the population, followed by TDS and Frontier at approximately 11%. The remaining three providers each covered between approximately 5% and 7% of the U.S. population.
2. Broadband Technology
Consumers access the Internet through a variety of fixed technologies, including cable broadband service, copper (including DSL), fiber to the premise, terrestrial fixed wireless service, and satellite service. These services differ in their availability, and also in characteristics such as speed, latency, reliability, and price. Cable services continue to be the technology with the largest portion of residential fixed broadband connections. In December 2021, approximately 62% of fixed residential connections were cable, 21% were fiber, 13% were copper-based, and the remaining 4% were split between satellite, terrestrial fixed wireless, and other technologies. Between 2017 and 2021, residential connections provided by cable operators, fiber networks, and fixed wireless also increased, while residential copper-based services, including DSL connections, continued to decline. (In contrast, residential satellite connections had periods of growth and decline.) Since 2018, fiber residential connections grew approximately 70%, and terrestrial fixed wireless grew approximately 101%.
Cable
Cable broadband service delivers broadband using infrastructure originally deployed for cable television. This service is provisioned over coaxial cables that deliver cable TV programming and internet service on separate channels (or frequencies). Currently, most providers of cable broadband service have deployed a hybrid fiber-coaxial (HFC) technology that transmits signals over fiber from the provider’s facility to an optical node near the consumer. These providers typically use coaxial cable to send the signal from the optical node to the customer’s end location. Data Over Cable Service Interface Specifications 3.1 (DOCSIS 3.1, if you're scoring at home), the latest cable standard deployed, is deployed to census blocks containing approximately 78% of U.S. households. In terms of speed, the weighted mean advertised download speed for cable broadband subscribers was approximately 178 Mbps as of October 2020, and participants, on average, experienced speeds that met or exceeded their advertised download speed. The weighted mean maximum advertised download speed for residential cable broadband connections was approximately 325 Mbps. Comcast and Charter almost exclusively provide fixed broadband through cable.
Fiber
Fiber-to-the-premises connections use optical fiber to deliver a signal from the operator’s equipment to the residential customer. This service can offer the consumer the highest speed among all currently available services because the fiber connects directly to the consumer’s residence. The weighted mean advertised download speed for residential fiber connections was 447 Mbps and participants, on average, experienced speeds that met or exceeded their advertised download speed. The weighted mean maximum advertised download speed for residential fiber connections was approximately 518 Mbps. Since 2020, fiber connections increased from 16.3 million to 24.2 million, a 49% increase in two years. Verizon covers almost 28% of its footprint with fiber.
Copper
Copper, including traditional DSL, is the oldest last-mile broadband technology still in use. It is commonly used by traditional telephone companies and transmits data via a modem over traditional copper telephone lines to consumers. Although widely available because it is built on the existing telephone network, this service is generally slower than other types of broadband services. Copper-based services, such as DSL service, are limited by the distance between the telephone provider’s central office and the consumer’s home such that the speed of the service decreases as the distance between these two endpoints increases. The weighted mean advertised download speed for residential DSL subscribers was 21 Mbps; however, participants, on average, experienced speed that did not meet their advertised download speed. The weighted mean maximum advertised download speed for residential DSL connections was approximately 30 Mbps. Since 2020, residential connections to copper services fell from 17.9 million to 15.2 million, a reduction of almost 15%. AT&T provides broadband access with a combination of technologies, covering approximately 95% of its service area with DSL.
Fixed Wireless
Terrestrial fixed wireless providers deliver broadband service to consumers using licensed, unlicensed, and shared access spectrum, while often relying on fiber optics to form parts of the rest of their network infrastructure. Terrestrial fixed wireless providers receive broadband content from an external distribution point via fiber or microwave connections, and then they deliver service to a customer’s fixed antenna from wireless transmitters on towers. The weighted mean maximum advertised download speed for residential fixed wireless connections reported in December 2021 was approximately 63 Mbps. Since 2020, residential connections increased from 1.5 million to 2.7 million, a 76% increase in two years. Moreover, consumers are gaining additional options with the rollout of 5G services. (T- Mobile’s entire fixed footprint is through terrestrial fixed wireless technology.)
As of December 2021, approximately 84% of the U.S. population lived in a census block that had access to terrestrial fixed wireless technology, compared to approximately 42% in December 2017. In addition to this technology becoming more widespread, the download speeds available through this technology also have increased; however, the speeds available may vary within each census block. In 2017, approximately 22% of the U.S. population lived in census blocks that had access to fixed wireless download speeds of 25 Mbps or less; however, by 2021, that number had fallen to just 4%. Conversely, the percentage of the U.S. population that lived in census blocks had access to download speeds between 25 Mbps and 50 Mbps had more than quadrupled. Notably in 2017, only about 1% of the U.S. population in a census block covered by terrestrial fixed wireless technology had access to download speeds between 250 Mbps and 500 Mbps; however, by 2021, that had increased seven-fold.
3. Broadband Access
Using what's known as "Form 477" data submitted by broadband providers, the FCC reports that, since 2018, the number of residential "fixed connections" (that is, not mobile/cellphone service) in the United States has increased over 14%, from approximately 101.3 million connections in 2018 to over 115.5 million connections in 2021.
In 2020 the FCC noted that more Americans had access to fixed broadband services, and those who previously had access were gaining access to newer broadband technologies capable of faster speeds. In the latest report, the FCC starts by noting that the number of fixed terrestrial residential connections capable of meeting a download speed threshold of 100 Mbps increased from approximately 66.4 million (as noted in the 2020 report) to 82.9 million, an increase of approximately 25 percent. Approximately 64 percent of households are located in census blocks that have at least two options for services meeting a 100/20 Mbps speed threshold; and approximately 4 percent of households are located in census blocks that have at least two options for services meeting a 940/500 speed threshold.
The FCC notes that as broadband speeds increase, so do prices across cable, DSL, fiber, and fixed wireless technologies.
II. Competitive Factors
The FCC looked at pricing speed, data caps, latency, packet loss, churn, and whether consumers have access to multiple providers.
1. Pricing
In November 2022 Consumer Reports research found that among the 18,359 consumer bills on which an internet price could be identified, the median cost of high-speed internet service was $74.99 per month. Approximately half of the households were paying between $60 and $90 per month. The FCC's own research has similar findings. Looking at the stand-alone plans of the top 11 fixed broadband providers in the United States, the FCC finds:
- Comcast has the most expensive cable plan, priced at $299 for download speeds up to 6000 Mbps, while Altice has the least expensive cable plan at $40 for download speeds up to 300 Mbps.
- AT&T’s 5000 Mbps plan is the most expensive fiber plan priced at $180 per month, and Frontier’s 500 Mbps plan and Verizon’s 300 Mbps plan are the least expensive fiber plans priced at $50.
- Lumen offers download speeds up to 100 Mbps at $50 per month, and Frontier offers speeds up to 25 Mbps for $50 per month over DSL.
- Verizon offers download speeds up to 650 Mbps and AT&T offers download speeds up to 25 Mbps priced at $70, which are the most expensive terrestrial fixed wireless plans, while T-Mobile offers download speeds up to 108 Mbps, JAB Wireless offers download speeds up to 25 Mbps, and Verizon offers download speeds up to 193 Mbps priced at $50, which are the least expensive terrestrial fixed wireless plans.
2. Speed
FCC research presents an actual speed for broadband providers, defined as the median speed experienced within a specific speed tier. Overall performance is calculated by determining the ratio of the median speed for each tier to the advertised tier speed and then calculating the weighted average of these based on the subscriber count per tier. The analysis shows that consumers’ actual broadband service speeds for most providers are close to or exceed the advertised speed. Of the nine 12 provider/technology configurations included in the communications market report, nine met or exceeded their advertised download speeds, two reached at least 90% of their advertised speed, and one performed below 90% of its advertised download speed.
Consistency of speed may be more important to consumers using applications such as video content that are both high-bandwidth and sensitive to variations in actual speed. FCC research considers two metrics of speed consistency. The first metric is the percentage of a provider's sampled panelists who experience an actual monthly average download speed that was greater than 95% of the pertinent advertised speed. The results show that consumers’ actual broadband service speeds for cable and fiber provide more consistent speeds than DSL. Cable and fiber provided speeds equal to or better than 95% of their advertised speeds to 89-98% and 53-98% of their subscribers, respectively. However, between 3% to 75% of DSL subscribers experienced speeds greater than or equal to 95% of their respective provider’s advertised download speeds during peak hours.
The second metric, the “80/80 consistent speed” metric, considers how speeds experienced vary during the day. The “80/80 consistent speed metric” measures the percentage of the advertised speed that at least 80% of subscribers experience at least 80% of the time over peak periods. Cable and fiber performed better than DSL with respect to the provision of consistent speeds. Cable and fiber provided greater than 95% of the advertised speed during peak usage periods to more than 80% of their panelists for more than 80% of the time. In contrast, the 80/80 consistent download speed for a DSL provider was 46% of the advertised speed.
3. Data Caps
Many fixed providers offer service plans that enforce a data cap, which means those who subscribe to that plan will be limited in the amount of data they can use each month. Those plans could be less expensive for consumers than unlimited plans depending on their data usage. Once a customer reaches their data cap, they are either charged for additional data they use or are subject to their speeds being reduced or throttled.
In 2022, research conducted by BroadbandNow found:
- Cable providers' data caps average 477 GB per month,
- Fiber data caps average 714 GB per month,
- DSL data caps average 638 GB per month, and
- Fixed wireless data caps average 325 GB per month.
4. Latency
Latency measures how much time it takes for your computer, the internet, and everything in between to respond to an action you take (like clicking on a link). FCC research found that differences in median latency among services offered by wireline providers are relatively small. Median latencies ranged from 8 ms to 28 ms. Measured DSL latencies (between 21 ms to 37 ms) were slightly higher than those for cable (12 ms to 26 ms) and median latencies for fiber were lowest (8 ms to 13 ms).
5. Packet Loss
A packet is lost if the latency exceeds three seconds or if the packet is never received. A 1% standard for packet loss is the point at which highly interactive applications such as Voice over Internet Protocol (VoIP) experience significant degradation in quality. Fiber has the lowest packet loss (0% to 5%), while DSL has the highest packet loss (4% to 8%).
6. Churn
Customer churn is the percentage of customers who stop paying for a service or product over a specific time period. Companies aim for lower churn rates because higher customer churn leads to a reduction in revenue. Many factors impact customer churn in the fixed broadband market: contract length, automatic payment options, bundled services, quality, and competition.
Subscribers receiving higher quality services are more likely to be satisfied and thus less likely to switch to a new provider. For the United States and Europe, an Analysys Mason survey indicates that “the benefits of higher speeds in terms of churn reduction grew between 2019 and 2020,” and in the United States, subscribers with higher download speeds are less inclined to churn due to higher satisfaction and reliability scores.
7. Access to Multiple Providers
Using year-end FCC Form 477 deployment data from 2018 to 2021, the commission assesses the number of fixed broadband provider options available to consumers across three minimum speed thresholds—25/3 Mbps, 100/20 Mbps, and 940/500 Mbps. The FCC analysis is reflected in the chart below.
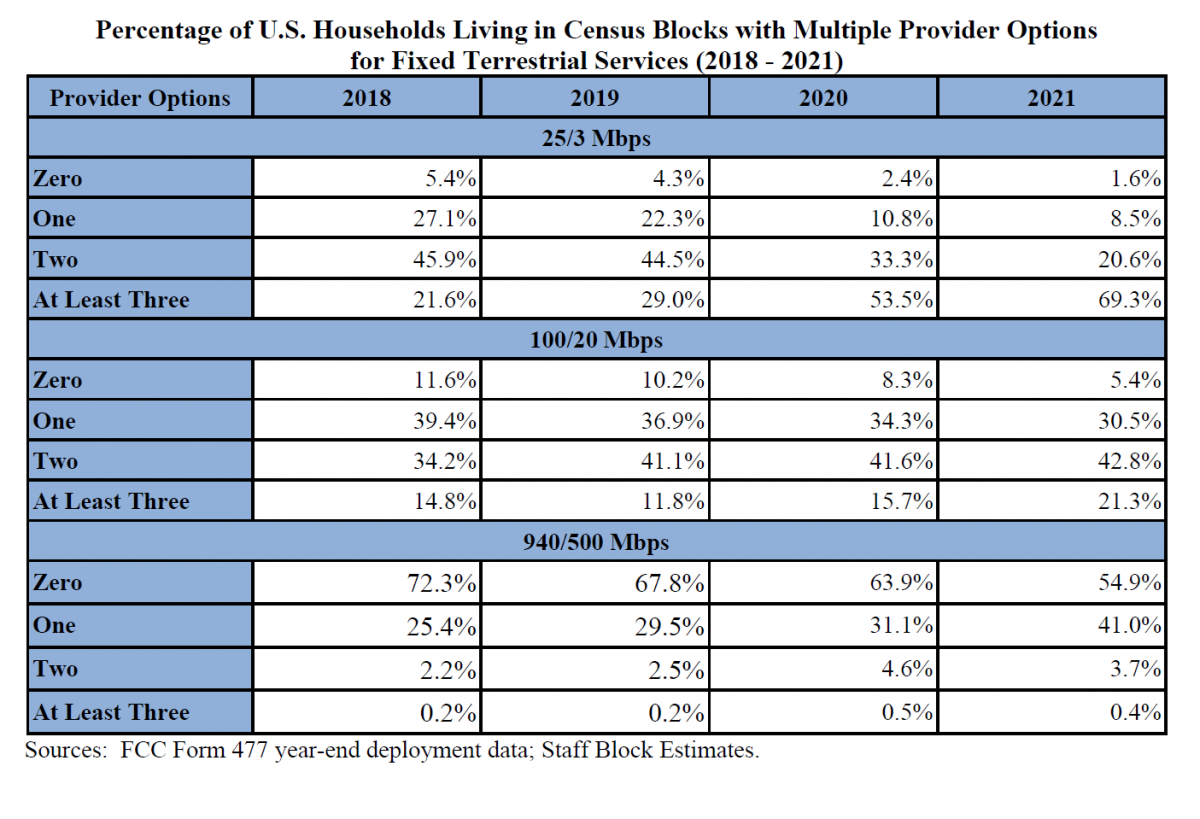
The FCC also evaluated the percentage of households that have a choice among multiple fixed terrestrial broadband service providers in rural and urban areas, and on Tribal lands. There is a significant difference in the percentage of households with at least two provider options in urban areas compared to those in rural areas and on Tribal lands. While almost 72% of the households living in census bocks in urban areas have at least two provider options for 100/20 Mbps service, less than 30% of households living in census blocks in rural areas and less than 34% of households on Tribal lands have at least two options in their census blocks for this service tier. Currently, for services meeting a 940/500 Mbps threshold, 4.5% of households in census blocks in urban areas have at least two options, compared to 2.6% of households in rural areas and 3.6% of households on Tribal lands.
FCC Agenda
Over the next two years, the FCC expects to continue efforts to connect every American to an affordable, high-speed broadband connection through its Universal Service Fund (USF) programs including:
- completing a targeted inquiry, commenced in May 2022, into the management and administration of the high-cost program that helps bring broadband to rural areas,
- better aligning the Lifeline program with the Affordable Connectivity Program,
- reforming the Rural Health Care Program to protect program integrity and ensure program participants receive adequate levels of support, and
- evaluating the USF contribution factor and contribution base.
Quick Bits
- FCC Announces Tentative Agenda for January Open Meeting
- Gigi Sohn Again Nominated for Federal Communications Commission (White House)
- An $8 Billion Phone Subsidy for Poor Is Targeted by Conservative Group (Bloomberg)
- ACP Outreach Grant & Pilot Programs Applications Due 1/9/23 (FCC)
- Broadband Data Collection Window Openned January 3, 2023 (FCC)
Weekend Reads (resist tl;dr)
- Effects of Market Structure on Broadband Quality in Local US Residential Service Markets (Journal of Information Policy)
- How COVID-19 Impacted U.S. Residential Internet Perceptions (Journal of Information Policy)
- Poor and diverse areas of Portland and Seattle offered slower and more expensive internet (Oregon Public Broadcasting)
ICYMI from Benton
- Broadband Provisions in the Consolidated Appropriations Act, 2023
- More Questions About Addressing Digital Discrimination
- Here's How the Infrastructure Investment and Jobs Act Will Make it Easier to Shop for Broadband Service
- What the FCC Wants to Know About ACP Service and Next Steps on Affordable Connectivity Program Transparency
- American Rescue Plan Helps Connect New Mexico
Upcoming Events
Jan 18—By the Numbers: Understanding and Driving Enrollment in the Affordable Connectivity Program (Benton Institute for Broadband & Society)
Jan 19—Internet for All: How Minority Serving Institutions Can Help Shape State Broadband and Digital Equity Plans and Initiatives (National Telecommunications and Information Administration)
Jan 19—How Can Policymakers Deter Fake Online Reviews? (Center for Data Innovation)
Jan 24—Public Wireless Supply Chain Innovation Fund Listening Session (NTIA)
Jan 26—Open Federal Communications Commission Meeting
The Benton Institute for Broadband & Society is a non-profit organization dedicated to ensuring that all people in the U.S. have access to competitive, High-Performance Broadband regardless of where they live or who they are. We believe communication policy - rooted in the values of access, equity, and diversity - has the power to deliver new opportunities and strengthen communities.
© Benton Institute for Broadband & Society 2022. Redistribution of this email publication - both internally and externally - is encouraged if it includes this copyright statement.
For subscribe/unsubscribe info, please email headlinesATbentonDOTorg

Kevin Taglang
Executive Editor, Communications-related Headlines
Benton Institute
for Broadband & Society
1041 Ridge Rd, Unit 214
Wilmette, IL 60091
847-328-3040
headlines AT benton DOT org
Share this edition:


Broadband Delivers Opportunities and Strengthens Communities