The Benton Institute ACP Performance Tool

Tuesday, May 2, 2023
Digital Beat
The Benton Institute ACP Performance Tool
Understanding the Geography and Drivers of Enrollment
The Affordable Connectivity Program (ACP) is at an inflection point. Launched in early 2022, ACP provides 17 million households up to $30/month in subsidies to offset the cost of broadband. But the program faces two critical challenges.
First, less than a third of eligible households currently participate in the program—mainly because the people who could benefit most from the subsidy are unaware that it exists. The Federal Communications Commission (FCC), local governments, and digital equity groups are stepping up efforts to improve ACP awareness and participation. Targeted outreach is needed to inform these households about the ACP and could benefit from analysis of the patterns of ACP enrollment.
Second, as successful as the program has been, ACP subsidies are at risk without Congressional action in the coming months. The initial ACP investment is dwindling which could mean the program will have to sunset in the next year. Analysis of enrollment patterns will show policymakers and advocates which places may suffer most from the program’s termination.
A Statistical Model for Predicting ACP Enrollment
We developed a statistical model that explains 63 percent of the variation in ACP enrollment across more than 25,000 U.S. 5-digit zip codes.(1) The model predicts ACP enrollment based on local factors that fall into two buckets:
- Individual factors: A household can only participate in ACP if it qualifies to do so. Estimating the number of eligible households in a given zip code area uses a procedure discussed here.
- Community influences: A wider range of phenomena may shape community enrollment performance, such as poverty rate, housing costs, rates of technology adoption (or deprivation), rural status, and racial or ethnic make-up of a community.
The choice to include factors beyond eligibility in the tool reflects a body of research that shows how social or environmental issues have an influence on individual choices. Raj Chetty and colleagues have shown how poverty affect’s individuals’ life chances; higher degrees of social connectedness across socio-economic (SES) lines are associated with higher incomes for low SES individuals. Similarly, research from the early days of personal computer adoption shows the network effect involved in household tech purchasing decisions. While controlling for a number of social and economic variables, the findings showed that computer adoption was higher in areas where large fractions of homes already owned computers.
More information about the statistical model that the Benton Institute’s ACP Performance Tool uses is here.
The Benton Institute ACP Performance Tool
The Benton Institute’s ACP Performance Tool is a resource for any community that wants to answer the question: “How are ACP sign-ups going?” To answer, search a 5-digit zip code on the tool’s website. The ACP Performance Tool returns results that show two important numbers for the zip code area: 1) how many households have signed up for ACP (from government data) and 2) the expected number of households enrolled (the output from a statistical model discussed more below).
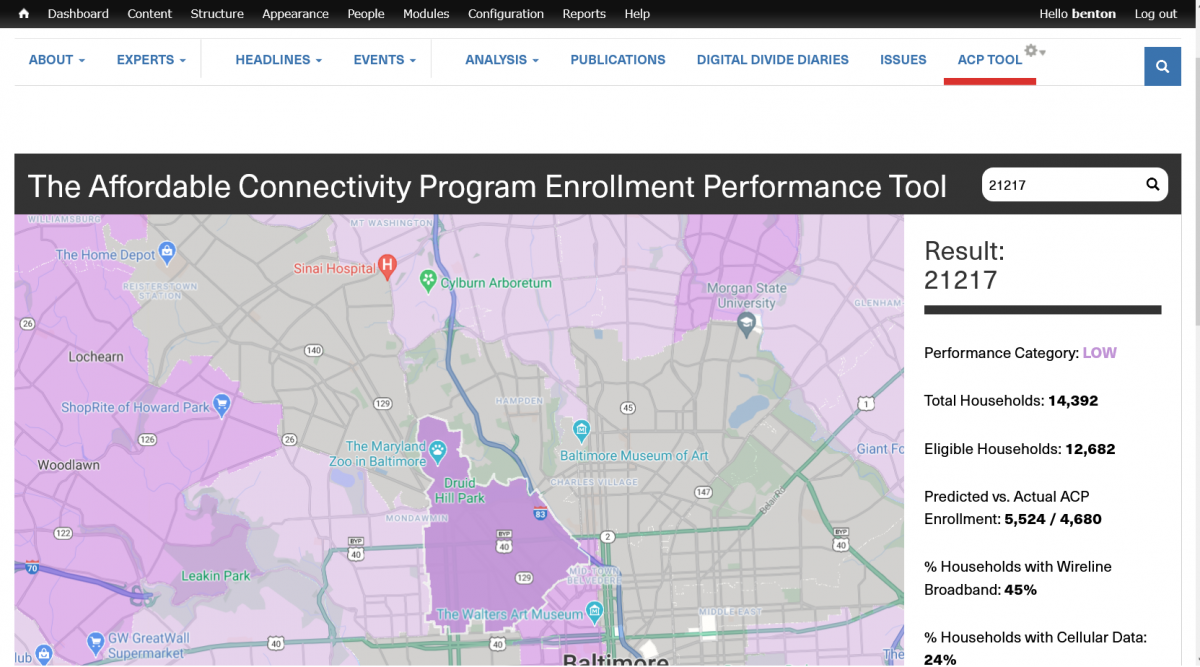
The difference between actual ACP enrollment and expected enrollment is a measure of performance. The tool places the zip code area into one of five performance categories:
- Highest: Where actual enrollments exceed expected enrollment by 40%
- High: Where actual enrollments are between 10% and 39% greater than expected
- Medium: Where actual enrollments fall between 9% and -9% of expectations
- Low: Where actual enrollments are between -10% and -39% of expectations
- Lowest: Where actual enrollments are below expected ones by 40% or less.
Using the Benton Institute ACP Performance Tool
One use for the ACP Performance Tool is to determine how to target digital inclusion grants in cities. State broadband planners, local communities, and digital equity practitioners are preparing for federal Digital Equity Act funding in the coming months, while cities such as Austin, Philadelphia, San Jose, Kansas City, and Washington (DC) already have digital inclusion grant programs in place. The ACP Performance Tool can help direct these efforts where they are most needed and where they might be the most effective. The ACP Performance Tool can tell decisionmakers, by zip code, where ACP enrollment meets expectations and where it is falling short.
Here’s an example from Baltimore, where areas to the east and west of the downtown have high poverty rates. A search on the 21205-zip code area in East Baltimore shows enrollment performance classified as “Medium” in that it enrolls just 32 households fewer than predictions. A nearby West Baltimore area (21217) is a “Low” performer; it has about 850 fewer households enrolled in ACP than expected.
Most cities have examples such as this. In Chicago, the Englewood-Greater Grand Crossing-Washington Park area (60621) shows “High” ACP performance, with about 1,750 more households enrolled than expected. Not far away, the Douglas-Grand Boulevard-Kenwood-Oakland area (60653) is a “Low” performer; there approximately 900 fewer households have signed up for the ACP than expected. Both areas have about one-third of households whose annual incomes are $15,000 or less and more than half of all households are “rent burdened” in both places (i.e., they pay more than 30 percent of their income for rent).
The differences in Baltimore, Chicago, and other places are, in themselves, of interest to decisionmakers. In the face of scarce resources to promote digital inclusion, the ACP Performance Tool helps identify, even within areas of high need, where problems are greatest.
Understanding the factors that drive differences in performance is also of interest, as it helps decisionmakers consider policy measures that may close performance gaps. Stay tuned for a discussion of this in our next article.
Notes:
- Zip codes with no reported ACP enrollment are not included in the model (or tool).
John B. Horrigan is a Benton Senior Fellow and a national expert on technology adoption, digital inclusion, and evaluating the outcomes and impacts of programs designed to promote communications technology adoption and use.
Brian Whitacre is Professor and Neustadt Chair in the department of Agricultural Economics at Oklahoma State University, where he studies the role of technology in rural economic development.
Hernan Galperin is Associate Professor at the USC Annenberg School for Communication where he studies Internet policy and social inequality.
The Benton Institute for Broadband & Society is a non-profit organization dedicated to ensuring that all people in the U.S. have access to competitive, High-Performance Broadband regardless of where they live or who they are. We believe communication policy - rooted in the values of access, equity, and diversity - has the power to deliver new opportunities and strengthen communities.
© Benton Institute for Broadband & Society 2023. Redistribution of this email publication - both internally and externally - is encouraged if it includes this copyright statement.
For subscribe/unsubscribe info, please email headlinesATbentonDOTorg

Kevin Taglang
Executive Editor, Communications-related Headlines
Benton Institute
for Broadband & Society
1041 Ridge Rd, Unit 214
Wilmette, IL 60091
847-328-3040
headlines AT benton DOT org
Share this edition:


Broadband Delivers Opportunities and Strengthens Communities